Hardware and performance
Kiwi TCMS is predominantly an I/O driven application where disk latency is more important than CPU performance and memory speed. This chapter documents our experiments and findings to establish a baseline against which administrators can plan their deployments.
Hardware requirements
In its default configuration Kiwi TCMS runs a web application and a database server as containers on the same hardware.
Minimum: 1 CPU, 1 GiB memory: t2.micro AWS instance works but runs at >90% memory utilization and risks unnecessary swapping and/or going out of memory! If you need to be on the low end use t2.small or t3.small instance
Recommended: 2 CPU, 4 GiB memory: the Kiwi TCMS team has had positive experience running on t2.medium and t3.medium AWS instances
Note
We’ve seen satisfactory performance with the default disk volume settings for AWS instances: EBS-optimized, General Purpose SSD (gp2), 100/3000 IOPS block storage. This is without any Linux filesystem related tweaks or changes to the default storage configuration of Docker Engine!
Write APIs execution speed
The various API methods in Kiwi TCMS will have vastly different execution speeds. Telemetry and search for example query tons of information from the database while browsing pages and reporting results uses less queries. A question that we often hear is How many test execution results can Kiwi TCMS deal with?
Important
The information below has been gathered by using the following environment:
Client: AWS t3.medium in us-east-1a (same availability zone as server)
Server: AWS t3.medium in use-east-1a, 30GB gp3 disk, defaults to 3000 IOPS, default throughput 125 MiB/s
Kiwi TCMS v14.0 via
docker compose upDatabase is
mariadb:11.6.2with a persistent volume backed onto the host filesystemHost OS - Ubuntu 24.04, freshly provisioned, no changes from defaults
api_write_test.py@ 748787a withRANGE_SIZE=100;locust --users 1 --spawn-rate 1 --run-time 60m --locustfile api_write_test.pyFor each invocation
api_write_test.pycreates new Product, Version Build and TestPlan. Test plan containsRANGE_SIZE x test casesthenRANGE_SIZE x test runs, each containing the previous test cases and finally updating results for all of them. This simulates a huge test matrix against the same test plan/product/version/build, e.g. testing on multiple different platforms (browser versions + OS combinations for example)The total number of test execution results is
RANGE_SIZE^2The total number of API calls is
10 + 3*RANGE_SIZE + 2*RANGE_SIZE^2Single client, no other server load in parallel
For RANGE_SIZE=100 we’ve got 10000 test execution results and
20310 API calls in a single script invocation!
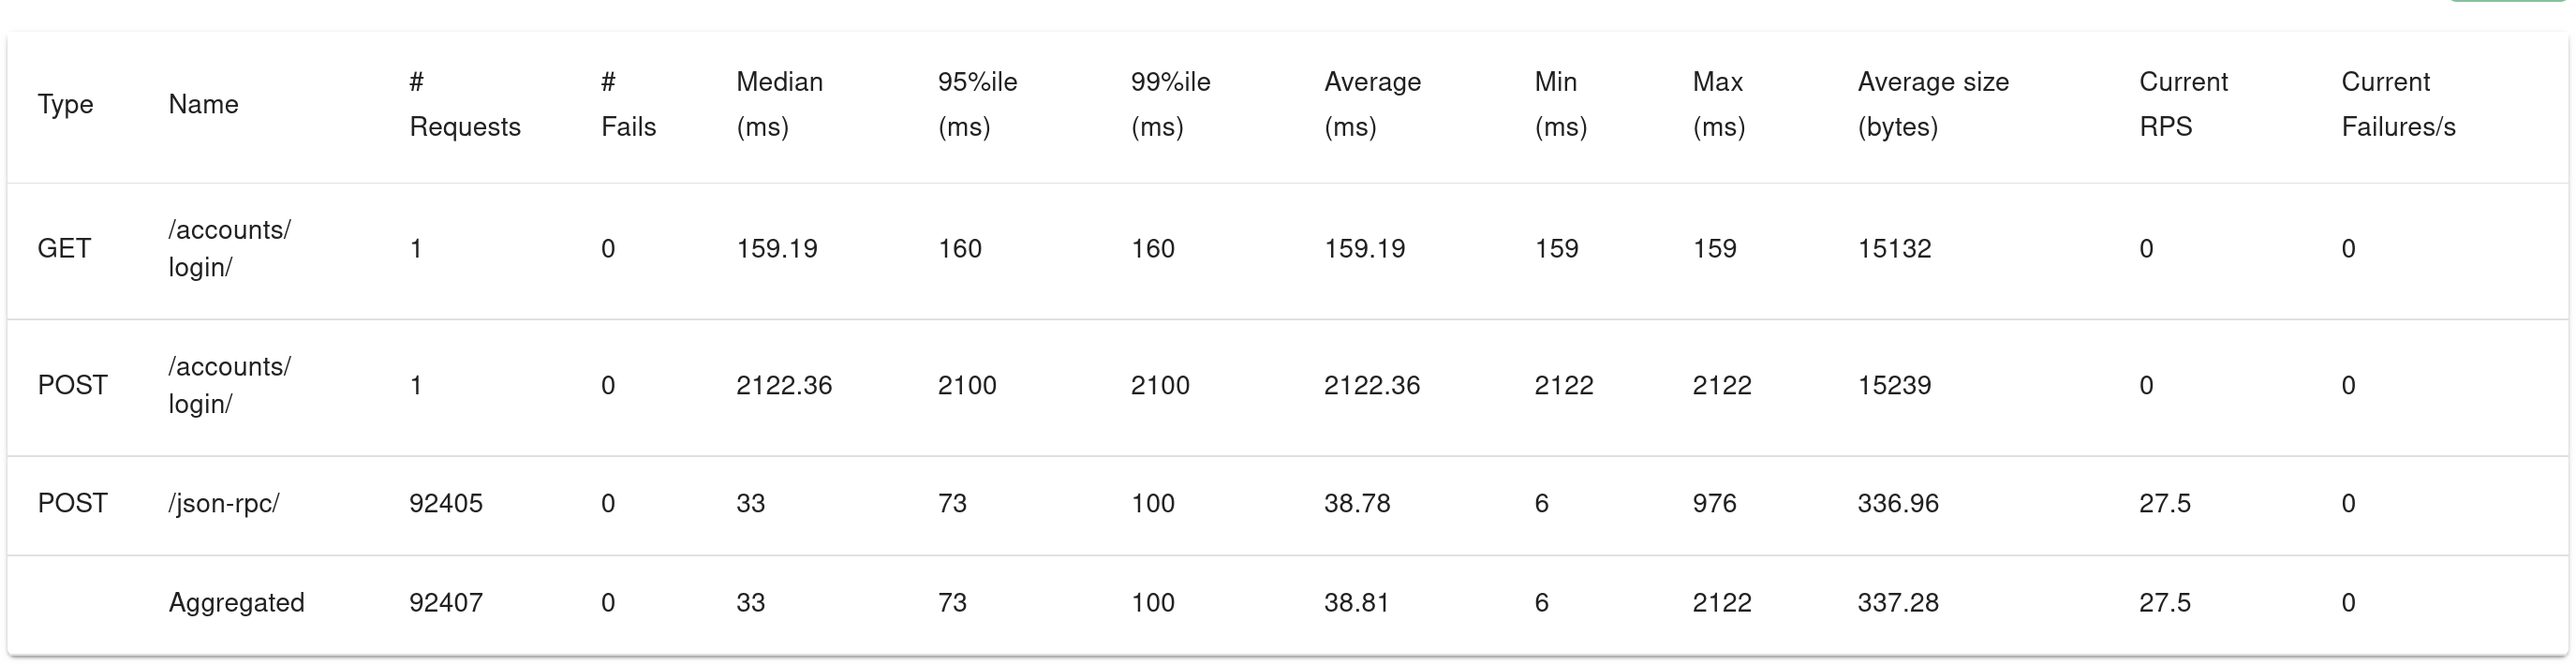
The results we’ve got are:
92000+ API calls/hour
45000+ test executions recorded/hour
25+ requests/second
33 ms/request (average); 73 ms/request (95%)
0 requests failed
Important
Using a vanilla postgres:17.2 as the database container resulted in worse
performance out of the box. For the same CPU/system load we saw numbers which
were only 60% of the ones reported above. Bombarding Kiwi TCMS with 2 Locust
users resulted in comparable outcome at the expense of CPU load averaging 90%
on the same hardware! This is due to several factors in the application framework:
More rigorous constraint checking in Postgres
Postgres is good at handling “long connections” while MariaDB is better at handling “short connections”
Connecting to Postgres is slower than connecting to a MariaDB (think process vs. thread)
Missing DB connection pooling as part of the application framework until very recently
Possibly Postgres performing more data analysis & optimization behind the scenes
Aside from involving a DBA to monitor and tailor the performance of your Postgres database to match the behavior of Kiwi TCMS there is little we can do about it!
Important
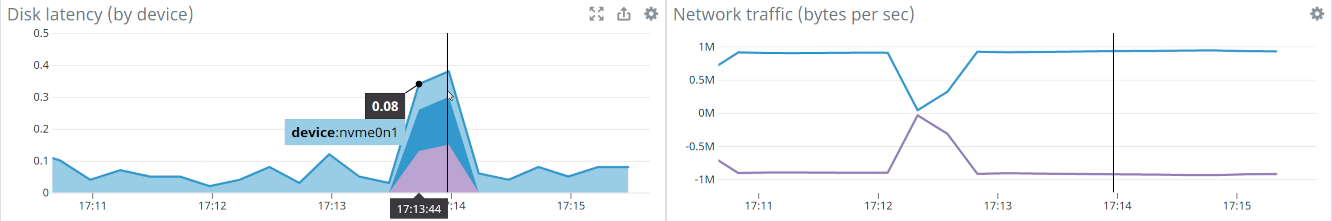
In the past (v12.0) we’ve also experimented with an i3.large storage optimized instance which has a
Non-Volatile Memory Express (NVMe) SSD-backed storage optimized for low latency and
very high random I/O performance. We’ve had to
mkfs.xfs /dev/nvme0n1 && mount /dev/nvme0n1 /var/lib/docker before starting the
containers.
While you can see that nvme disk latency is an
order of magnitude faster (< 0.1 ms) with the occasional peak from the root filesystem
the overall application performance didn’t change a lot. The times for RANGE_SIZE=30 improved
but the times for RANGE_SIZE=100 worsened a bit.
This means few things:
The presented metrics above are generally representative and you can use them to plan your deployment
Going overboard on hardware, especially disk performance isn’t necessary
Somewhere else in Kiwi TCMS there is a bottleneck which we’re still to investigate and improve! Pull requests and more profiling information are welcome.
Upon further investigation we devised two additional scripts to aid in discovering possible bottlenecks:
perf-script-orm which talks directly to the ORM layer simulating comparable number of DB operations
perf-script-static which simulates the same number of API requests without touching the database. This can be used as a rough estimate of how much time is spent during web/API handling
During experiments with these two scripts CPU, Network and Disk metrics remained similar to previous executions which supports the theory of bottleneck in the application instead of hardware or operating system.
Results against the same server with R=100 yielded the following:
1120 sec for
perf-script-ng234 sec for
perf-script-orm333 sec for
perf-script-static
Which translates as:
20% of the time is spent in ORM/DB operations
30% of the time is spent in the web/API stack
50% of the time is spent in additional computation for each API function, e.g.
permissions check
input validation
fetching objects by id
calculating sortkey and/or test run completion status
serialization
Each API function has its own individuality but the biggest contenders in this case seem to be
TestRun.add_case and TestExecution.update. However more profiling information for every API
function is needed in order to make a final verdict.
Read APIs execution speed
To establish a baseline for read APIs we’ve chosen the TestCase.filter and
TestRun.filter methods which are used in the search pages. The experiment
is performed inside the following environment:
Client is t3.small AWS instance
Server is t3.medium AWS instance
Both client and server are located in the us-east-1a region in AWS
Result size for both methods is 10000 records serialized as JSON
Search page was loaded and then the Search button was pressed additional times for a total of 5 executions
The results are as follow:
TestCase.filter: min 725 ms, max 930 ms for 5.73 MB data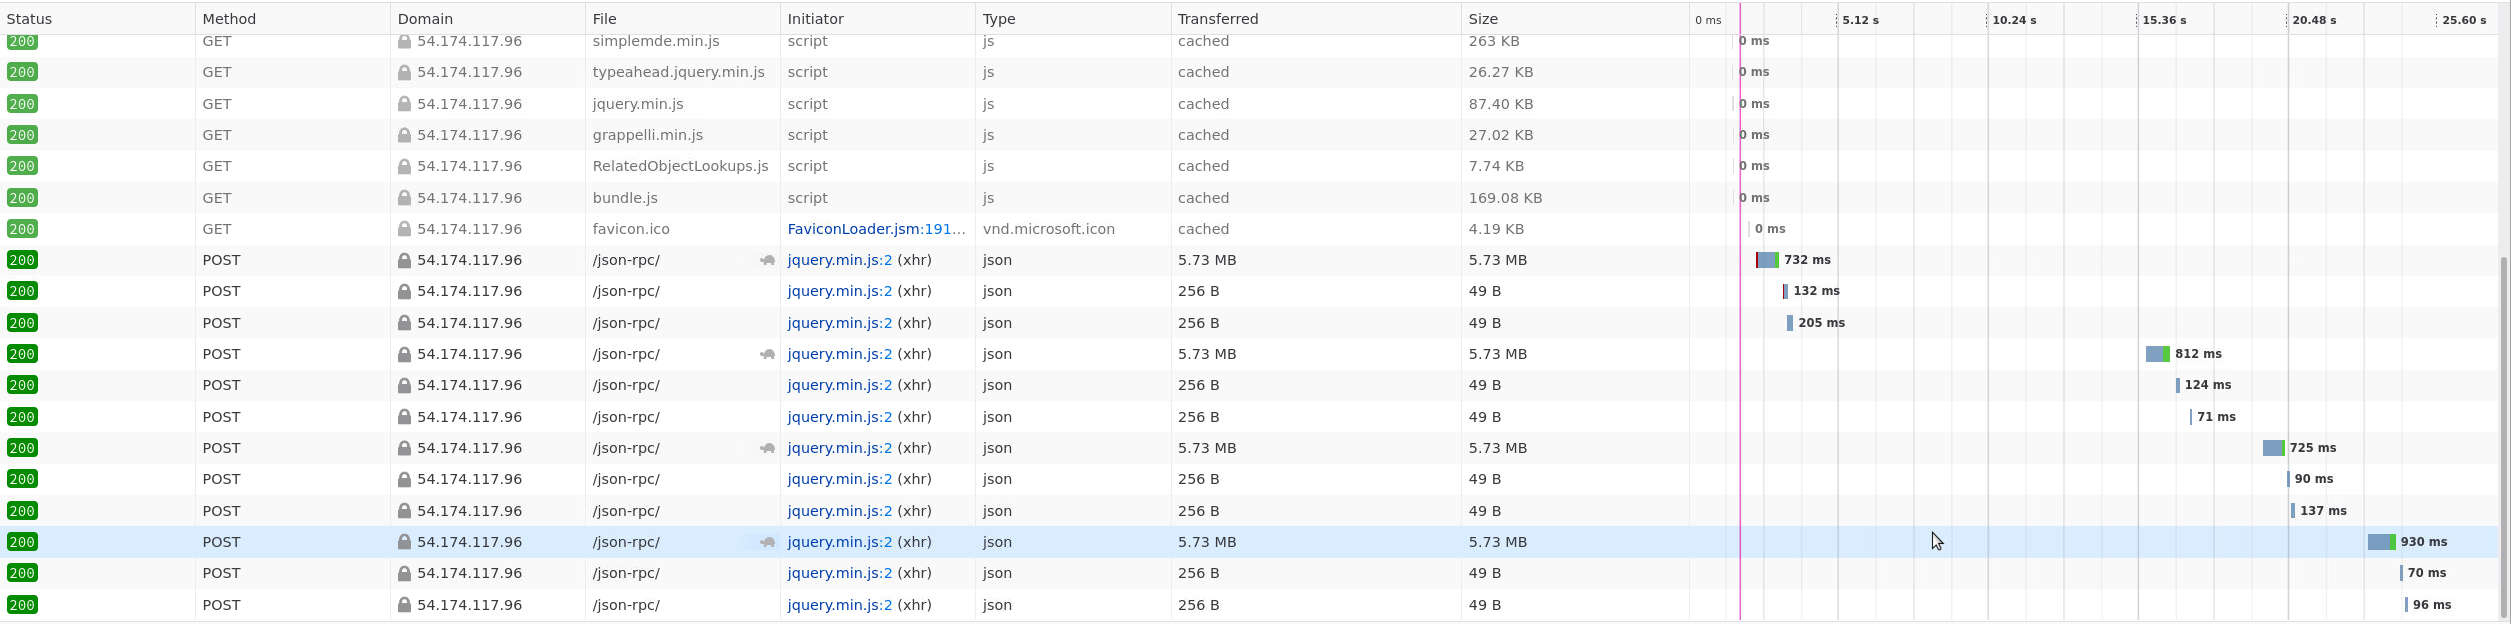
TestRun.filter: min 560 ms, max 921 ms for 5.16 MB data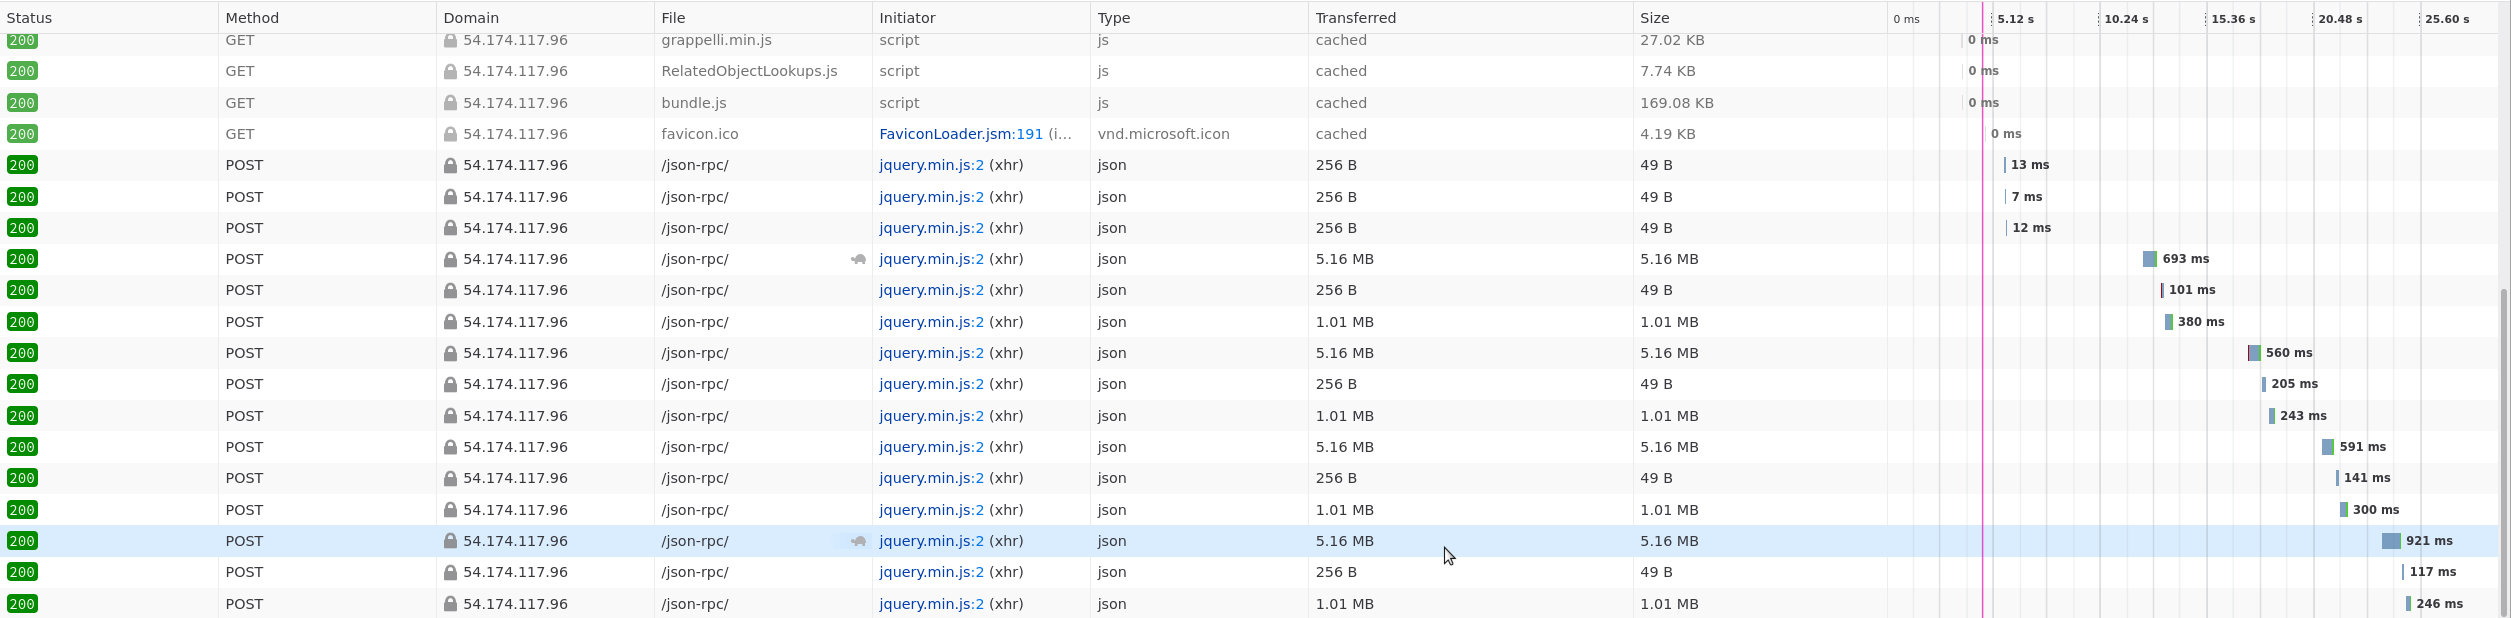
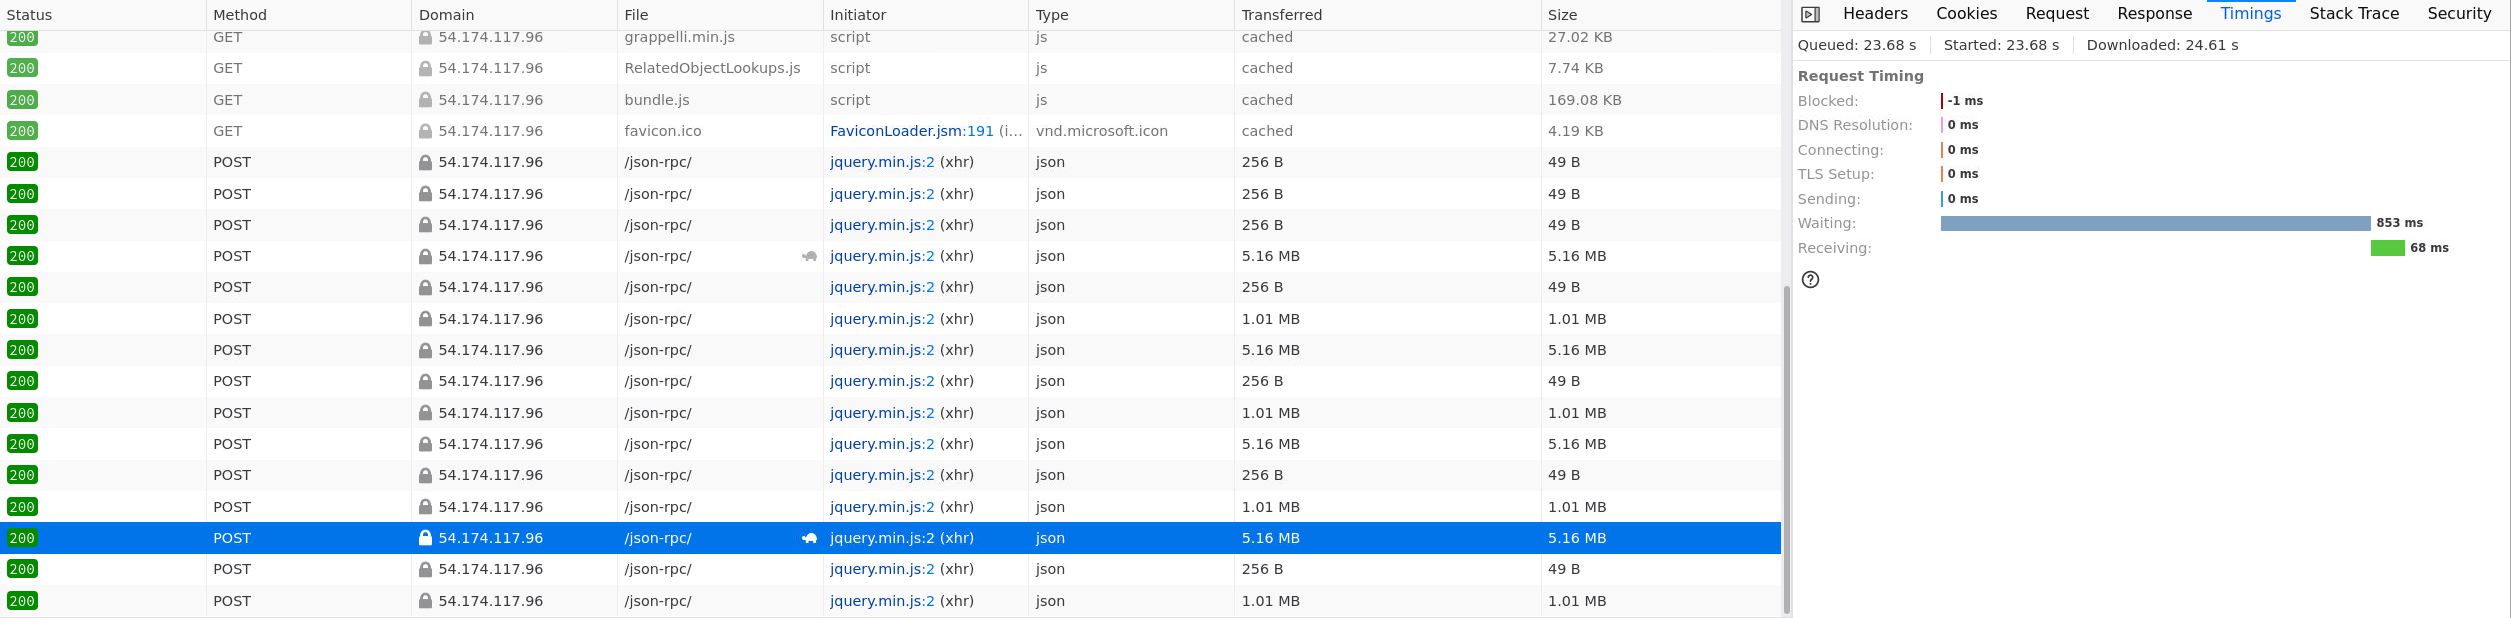
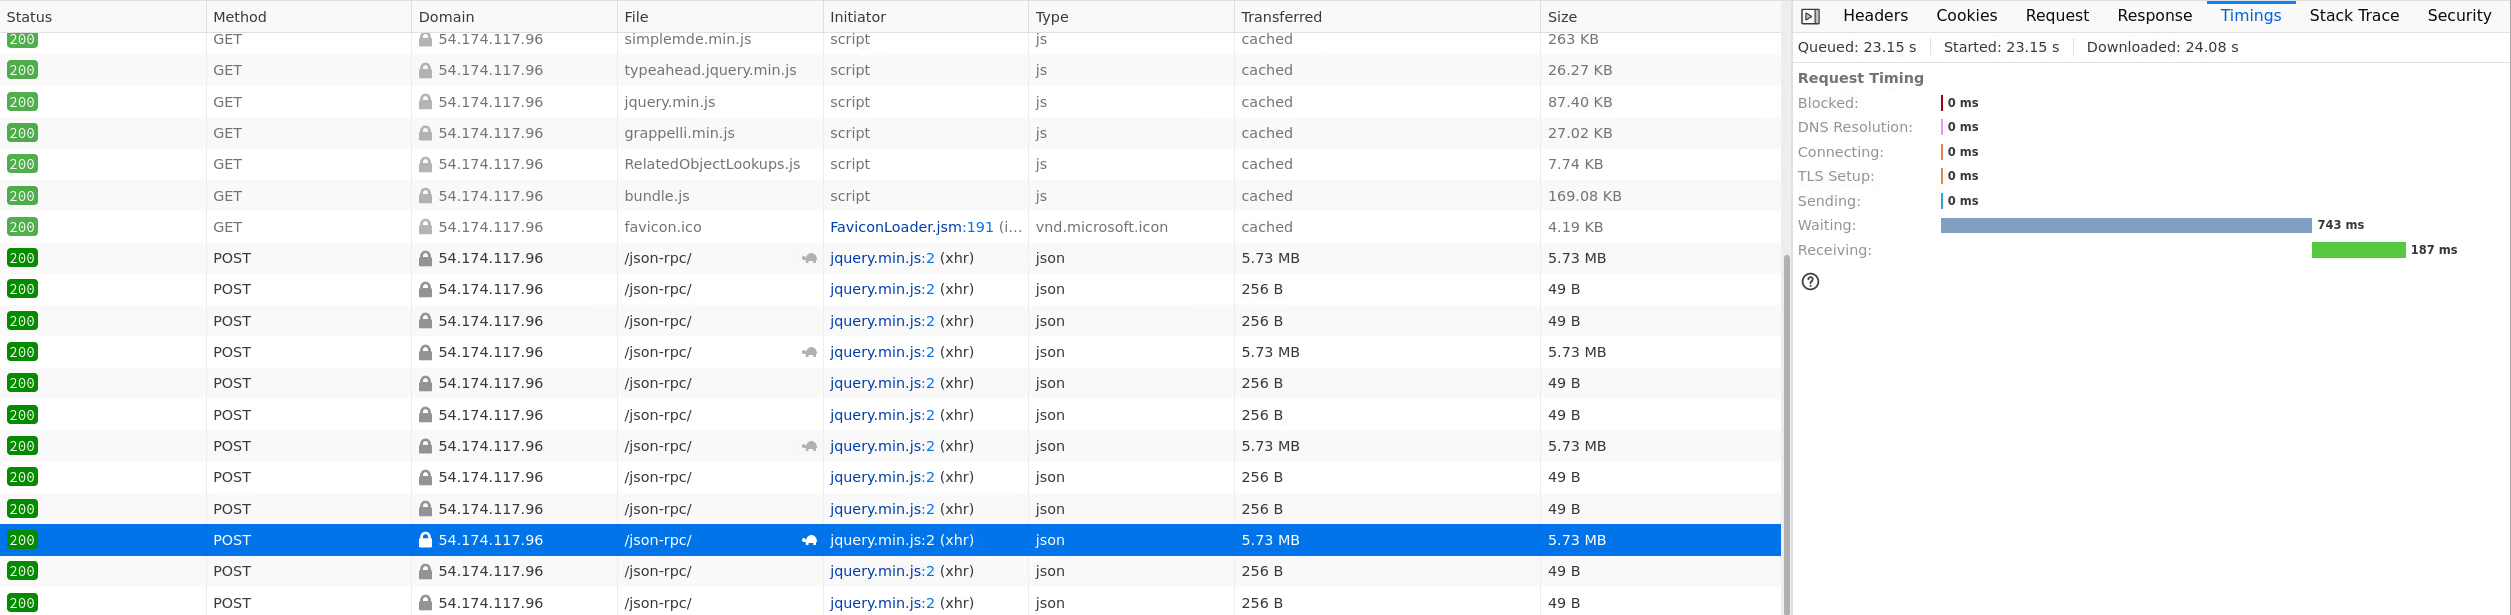
In the case where the client is across the world reaching the server through the Internet the timings are quite different with most of the time being taken to transfer the actual information:
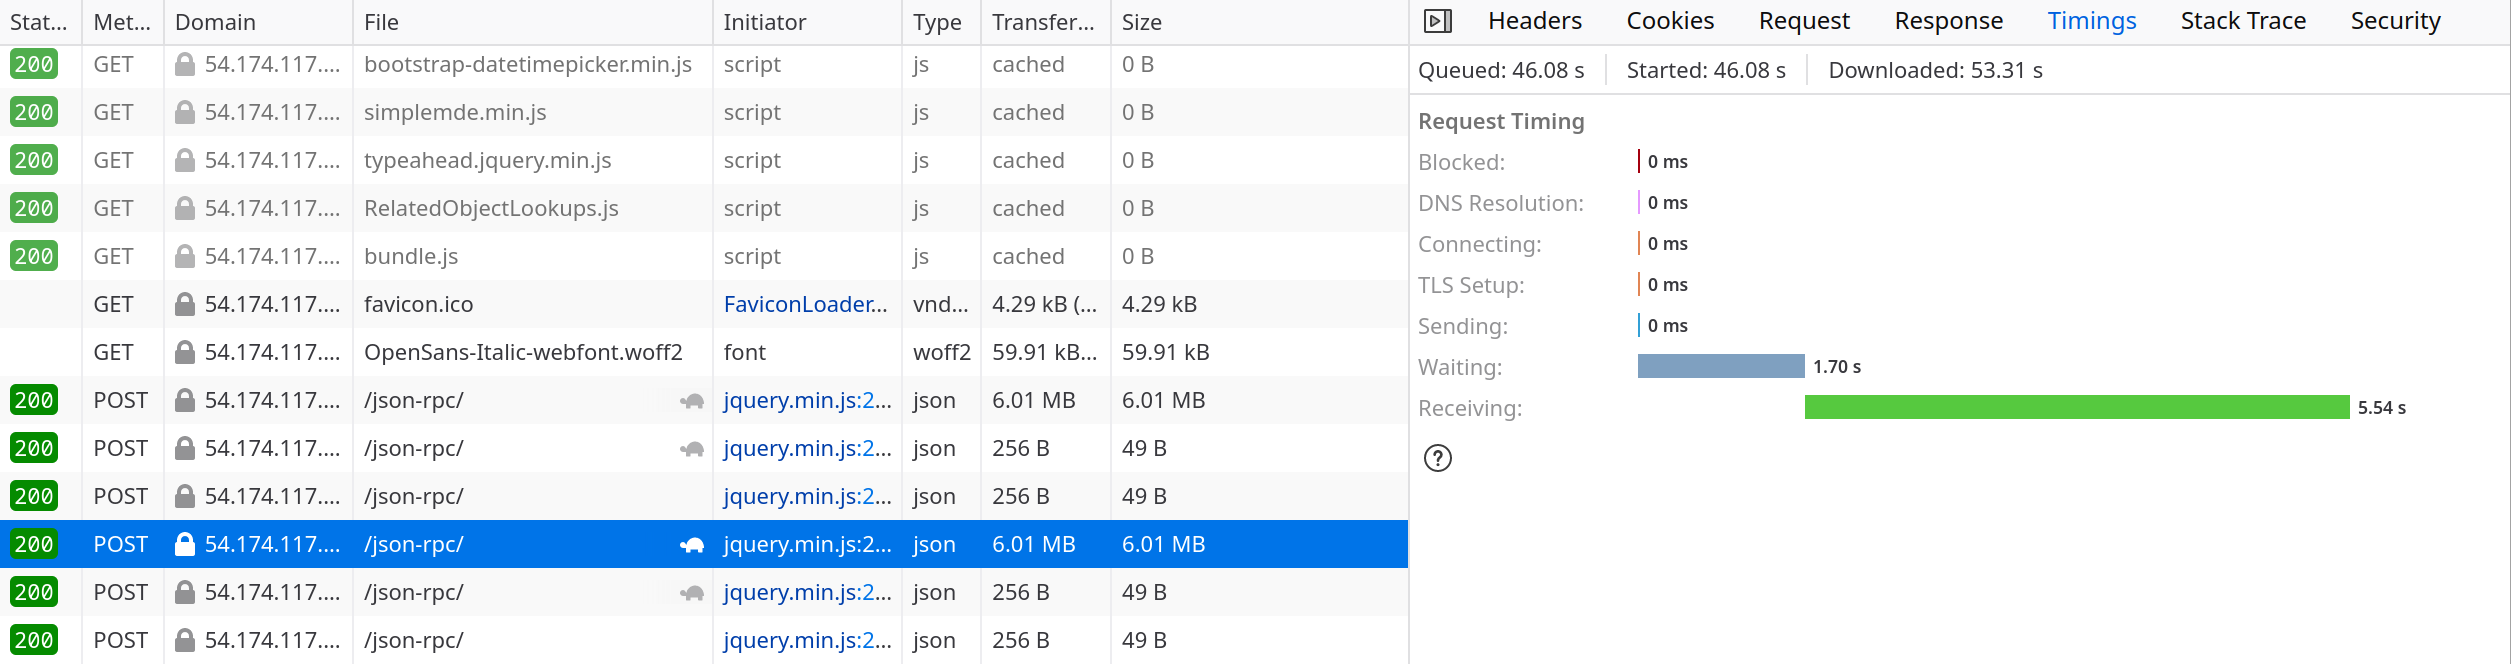
Important
Firefox timing metrics are explained in Mozilla’s documentation
Parallel user sessions performance
Another important question is How many parallel users can Kiwi TCMS support? and the answer to this question is heavily dependent on what these users are actually doing and how they are interacting with the application which is vastly different between various teams and organizations.
To help answer this question we’ve created the web_simulation_test.py script
which uses the Playwright to simulate realistic user activity as if it was
from a browser. The script implements the top 10 most common activities such as
viewing the dashboard page, creating test plans and test cases and reporting
execution tesults in test runs. These actions and their frequency were created
using our anonymous analytics metrics!
Implementation includes random sleep and varying number of artifacts to
simulate a plausible human interaction. In all scenarios pages were left to
load and exercise their default JavaScript actions - for example search pages
will query and fully load all the results!
Important
The information below has been gathered by using the following environment:
Client: AWS c6a.metal (192 CPU core) in us-east-1a (same availability zone as server)
Server: AWS t3.medium in use-east-1a, 30GB gp3 disk, defaults to 3000 IOPS, default throughput 125 MiB/s
Kiwi TCMS v14.0 via
docker compose upDatabase is
mariadb:11.6.2with a persistent volume backed onto the host filesystemHost OS - Ubuntu 24.04, freshly provisioned, no changes from defaults
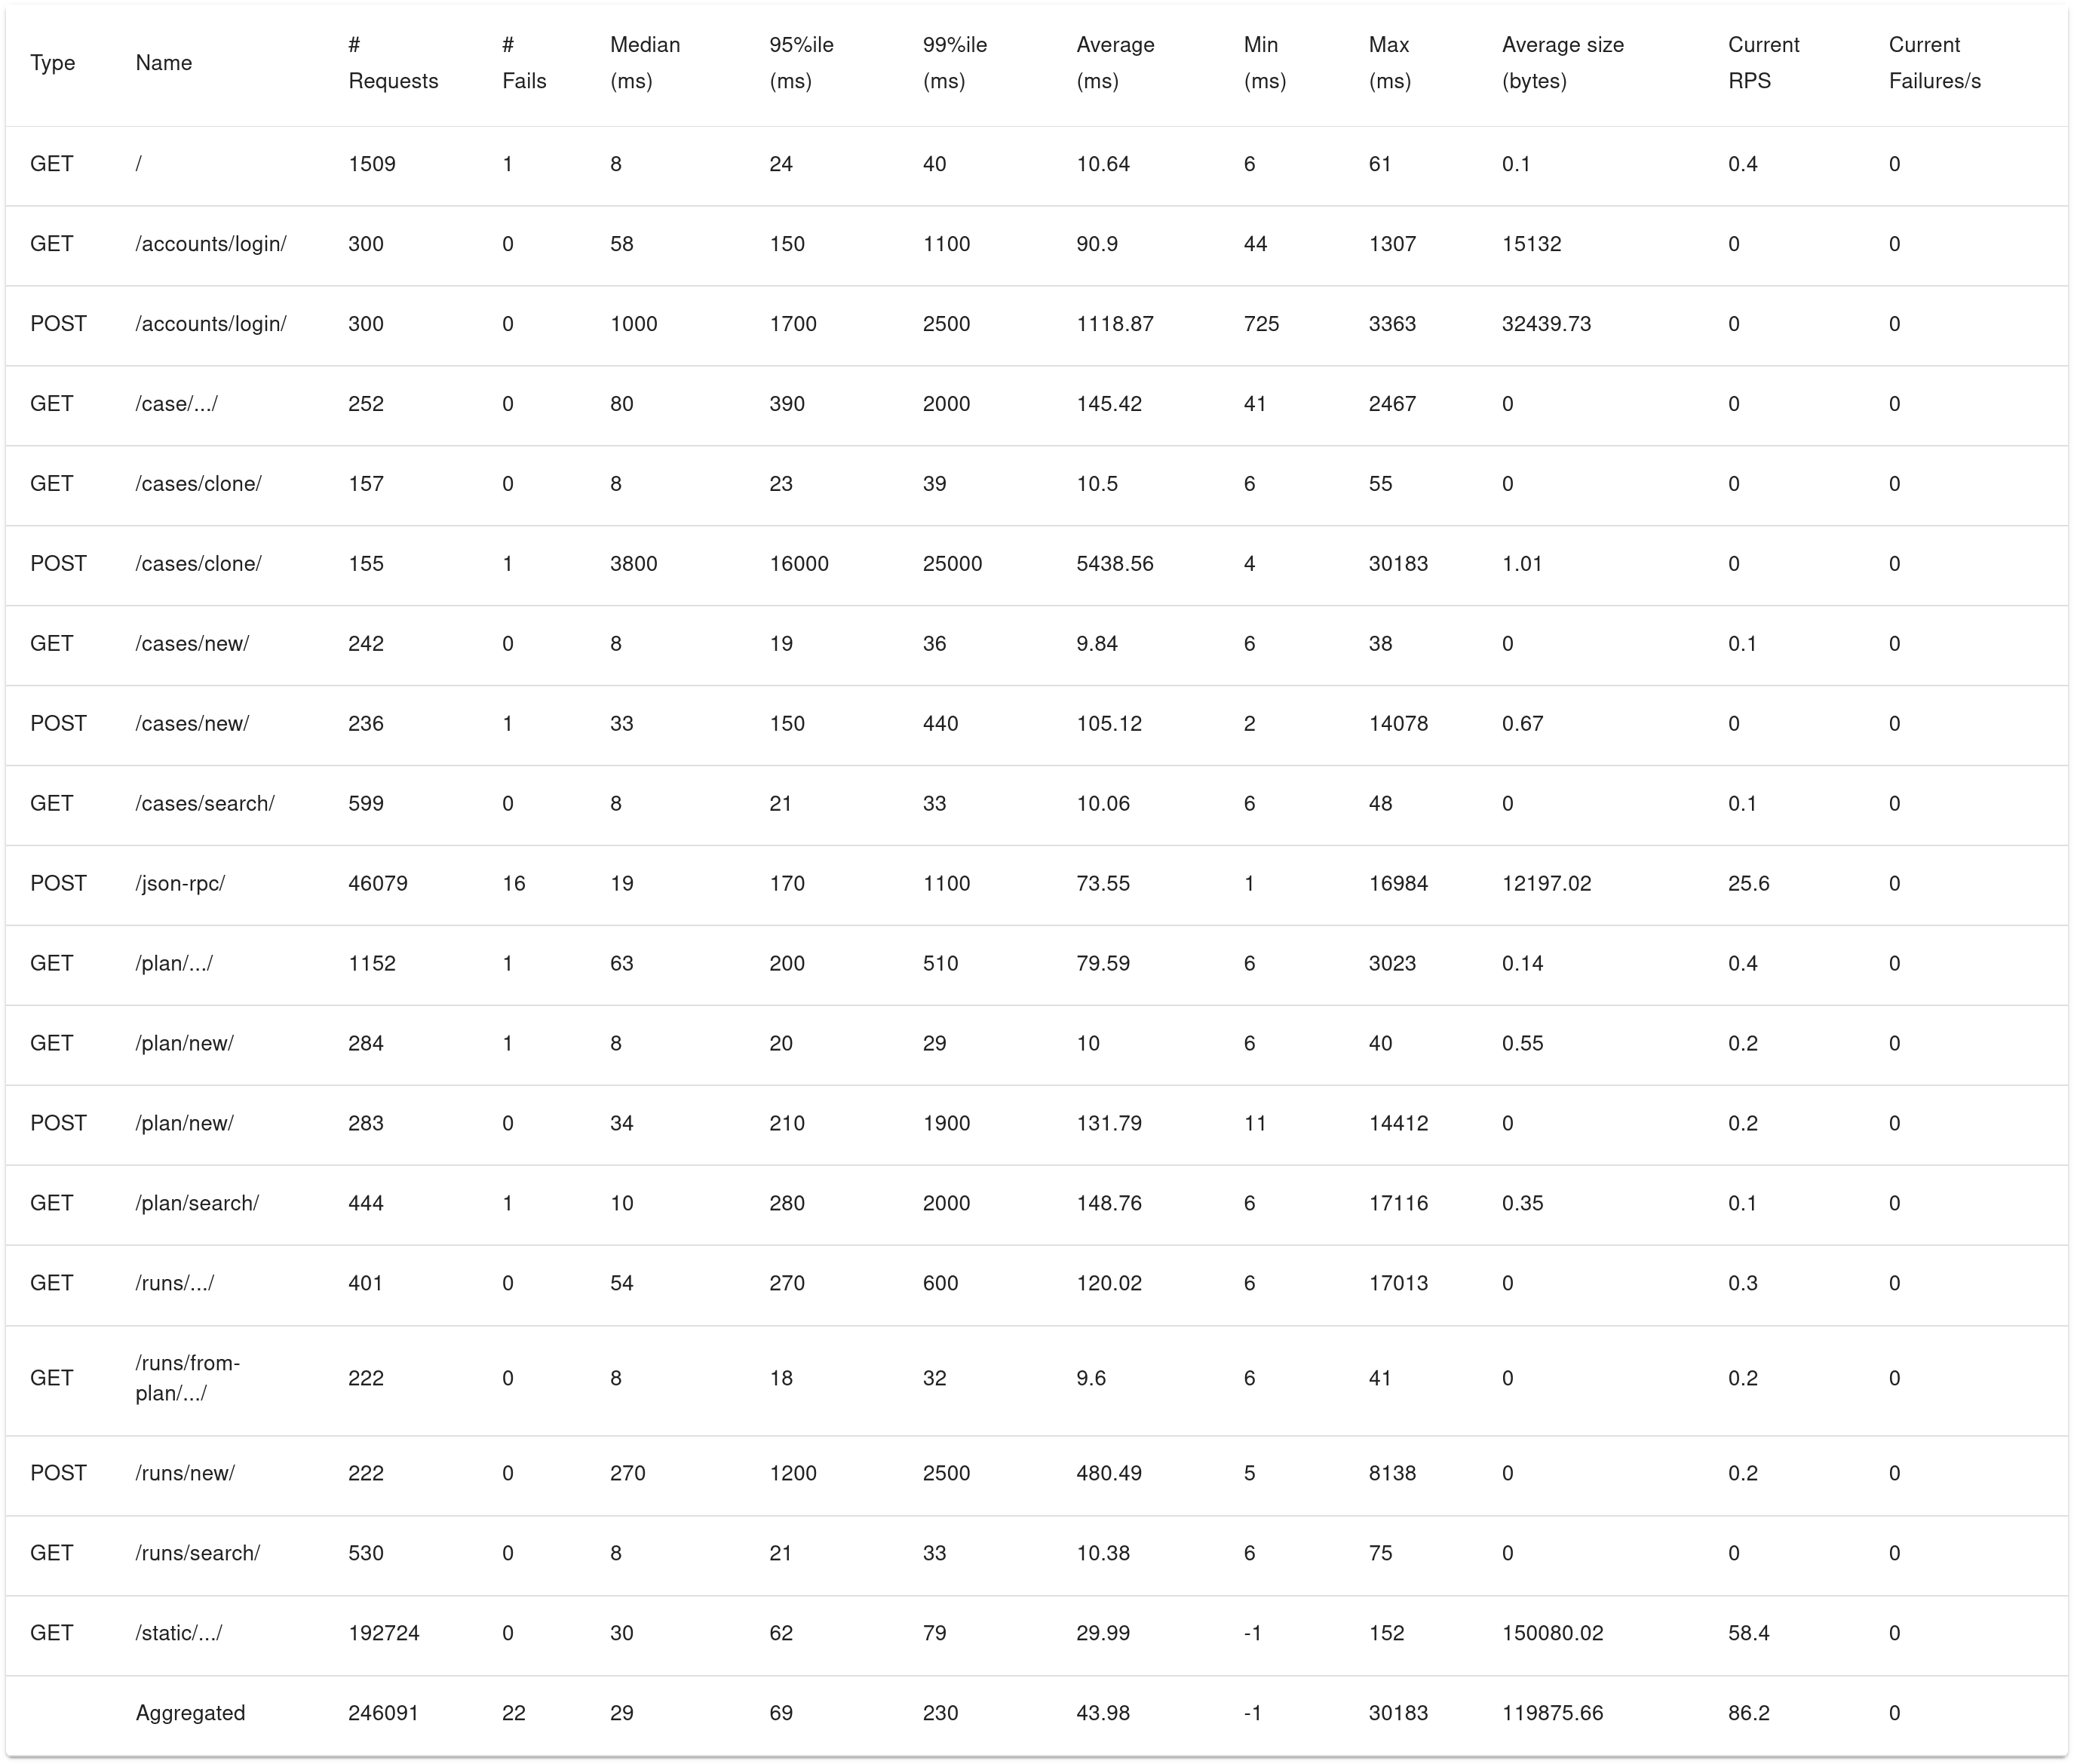
web_simulation_test.py@ 87dd61flocust --processes -1 --users 300 --spawn-rate 0.33 --run-time 60m --locustfile web_simulation_test.py~ 15 min ramp-up of all users; then steady load
Existing state: 20 x TestPlan; 200 x TestCase; 200 x TestRun
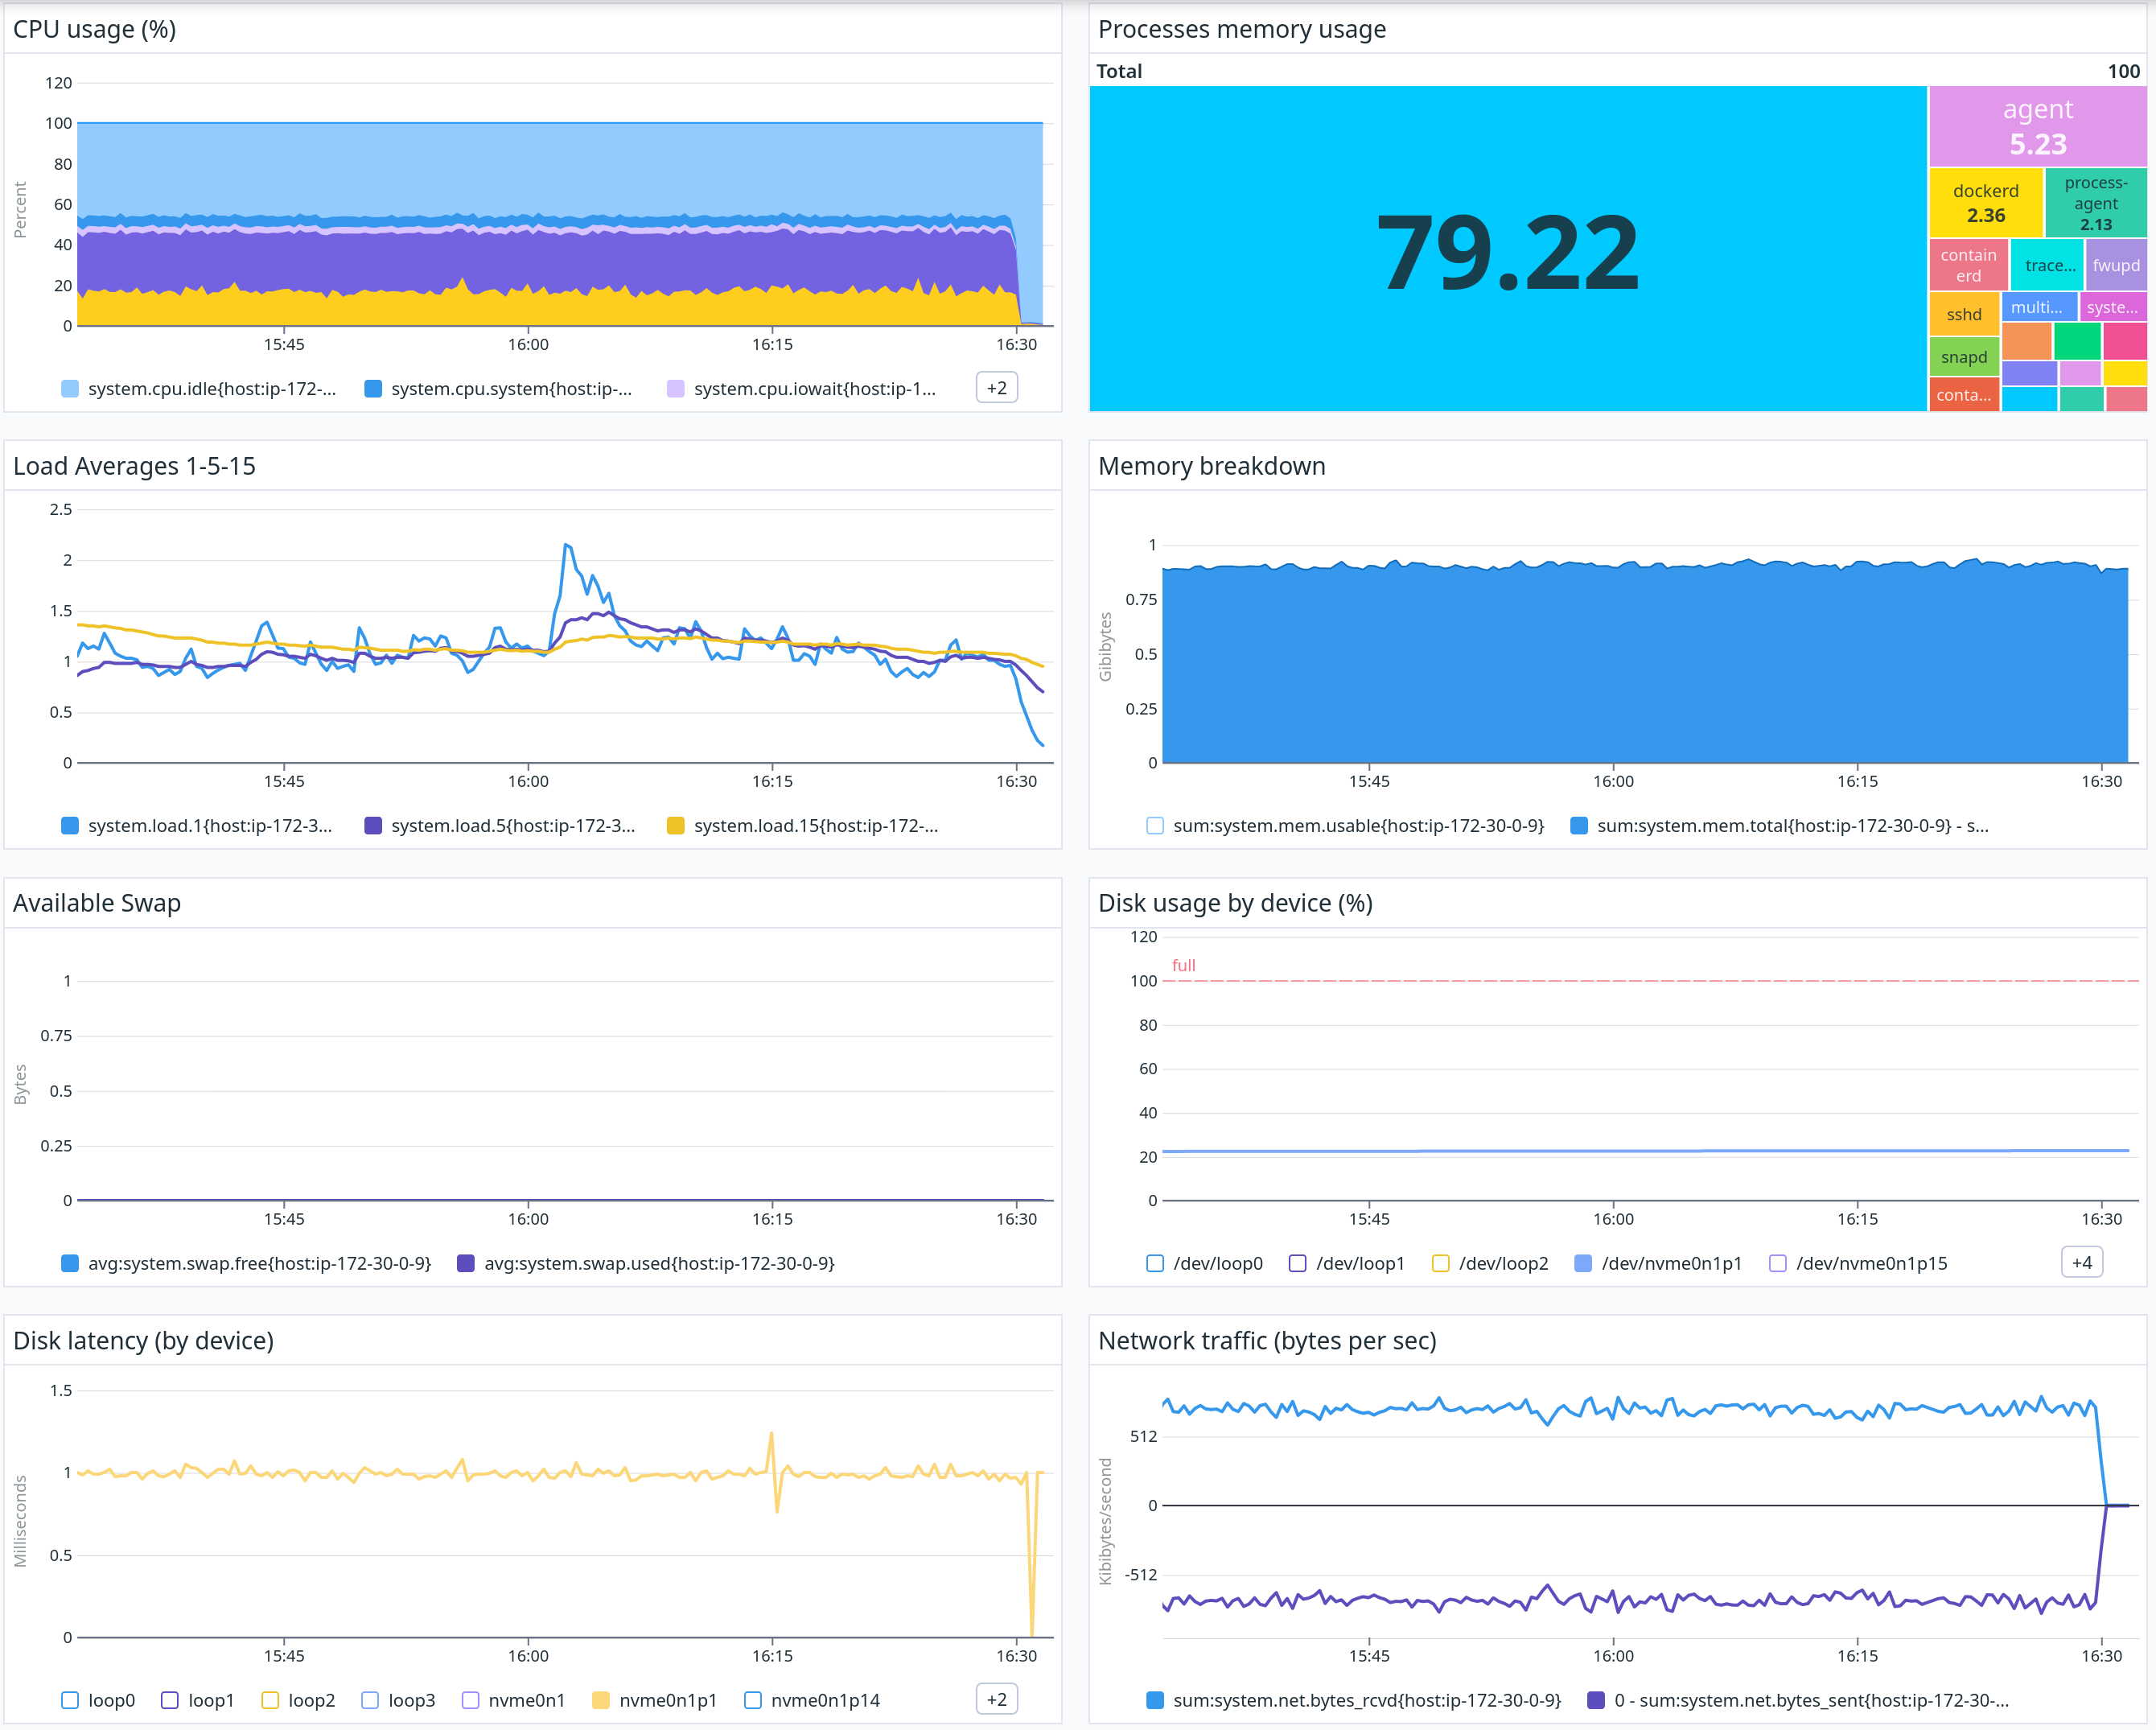
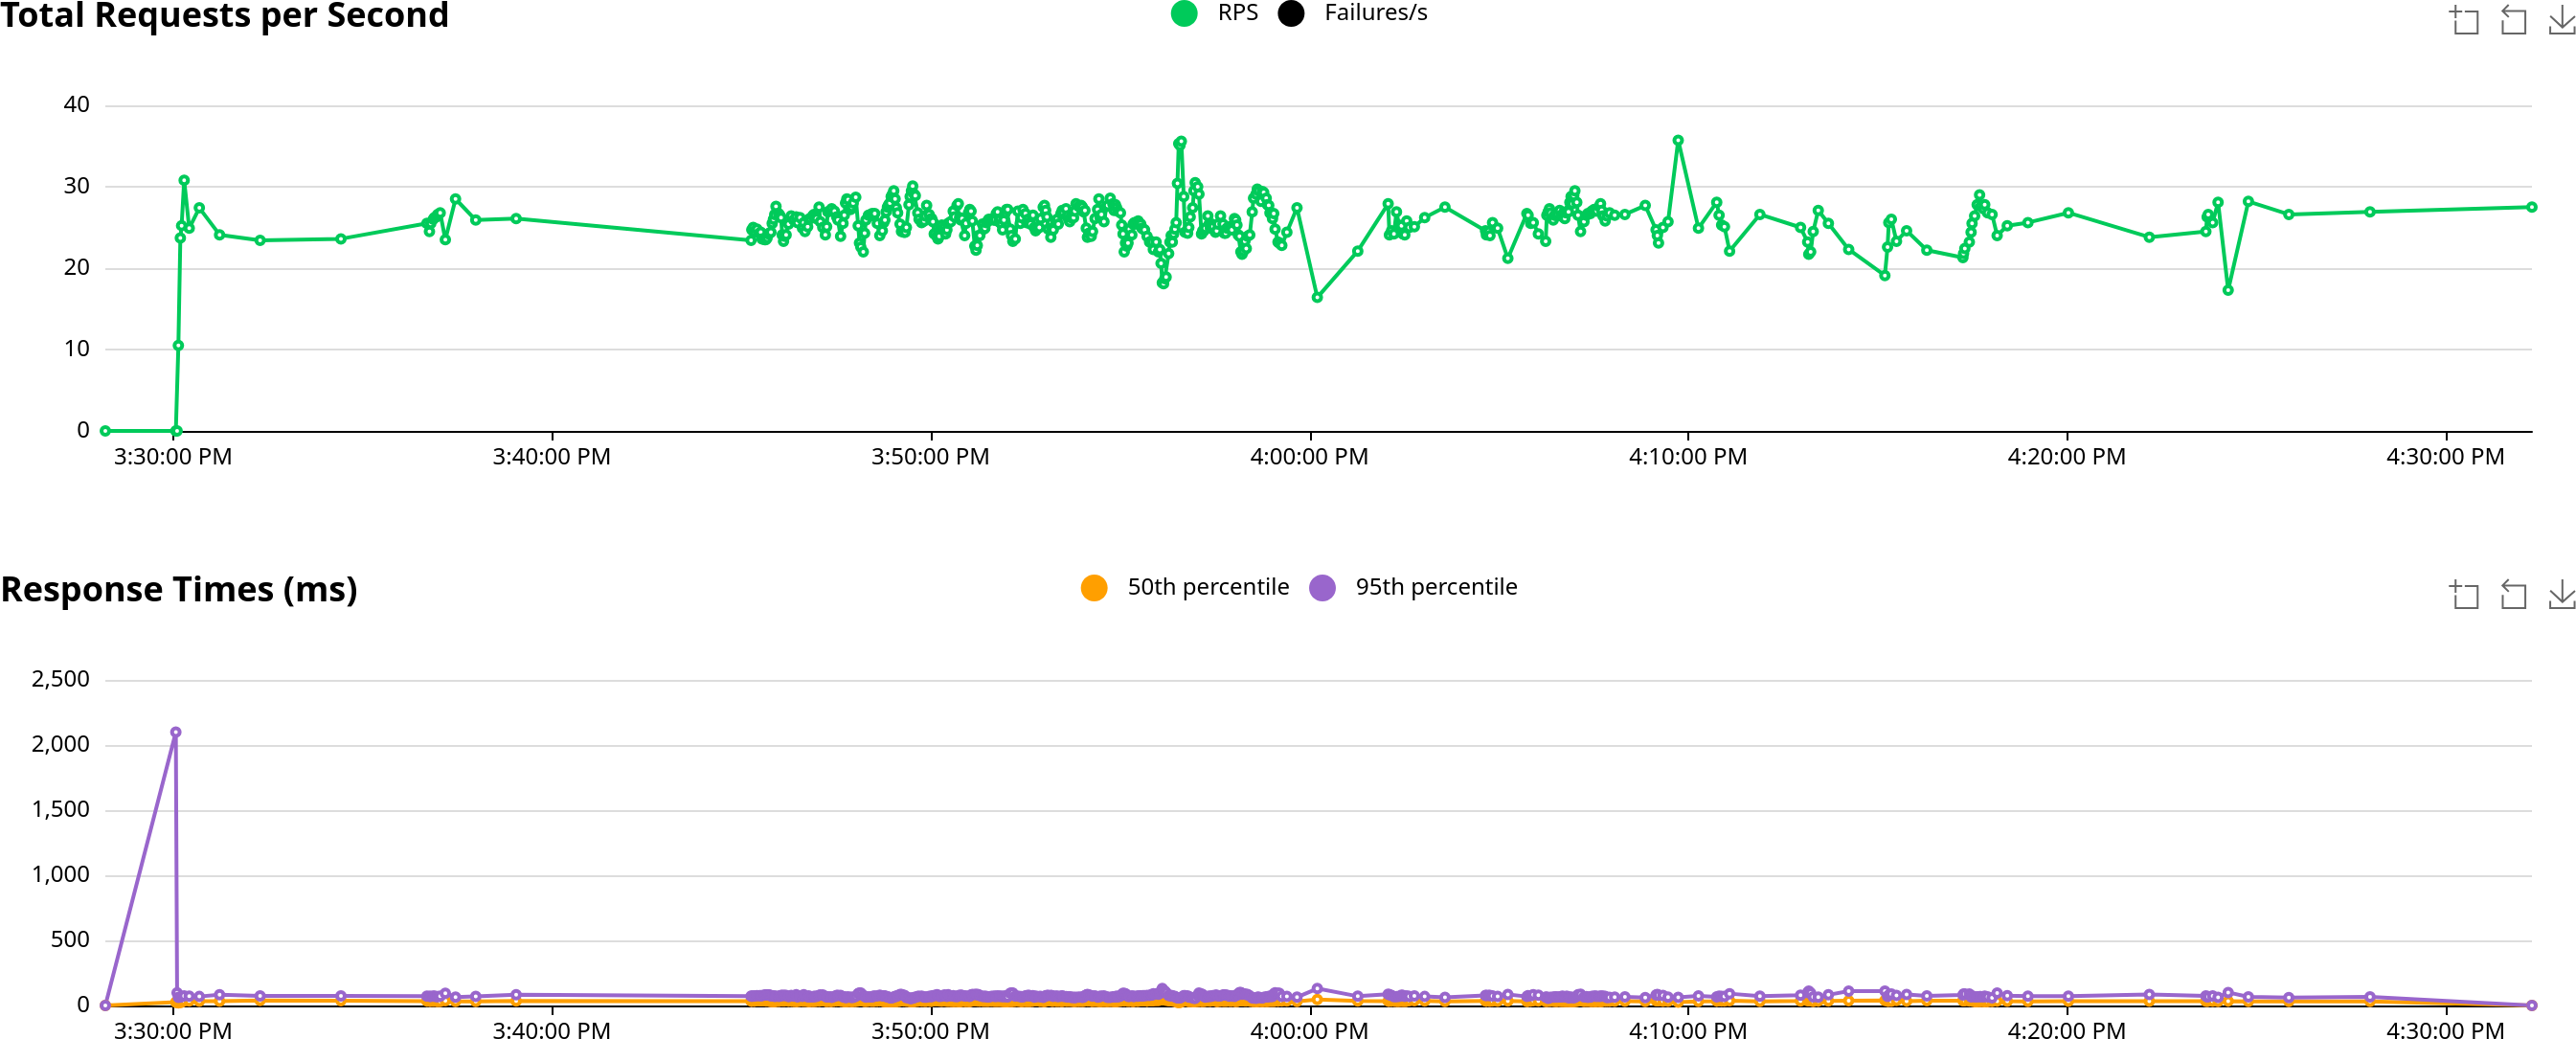
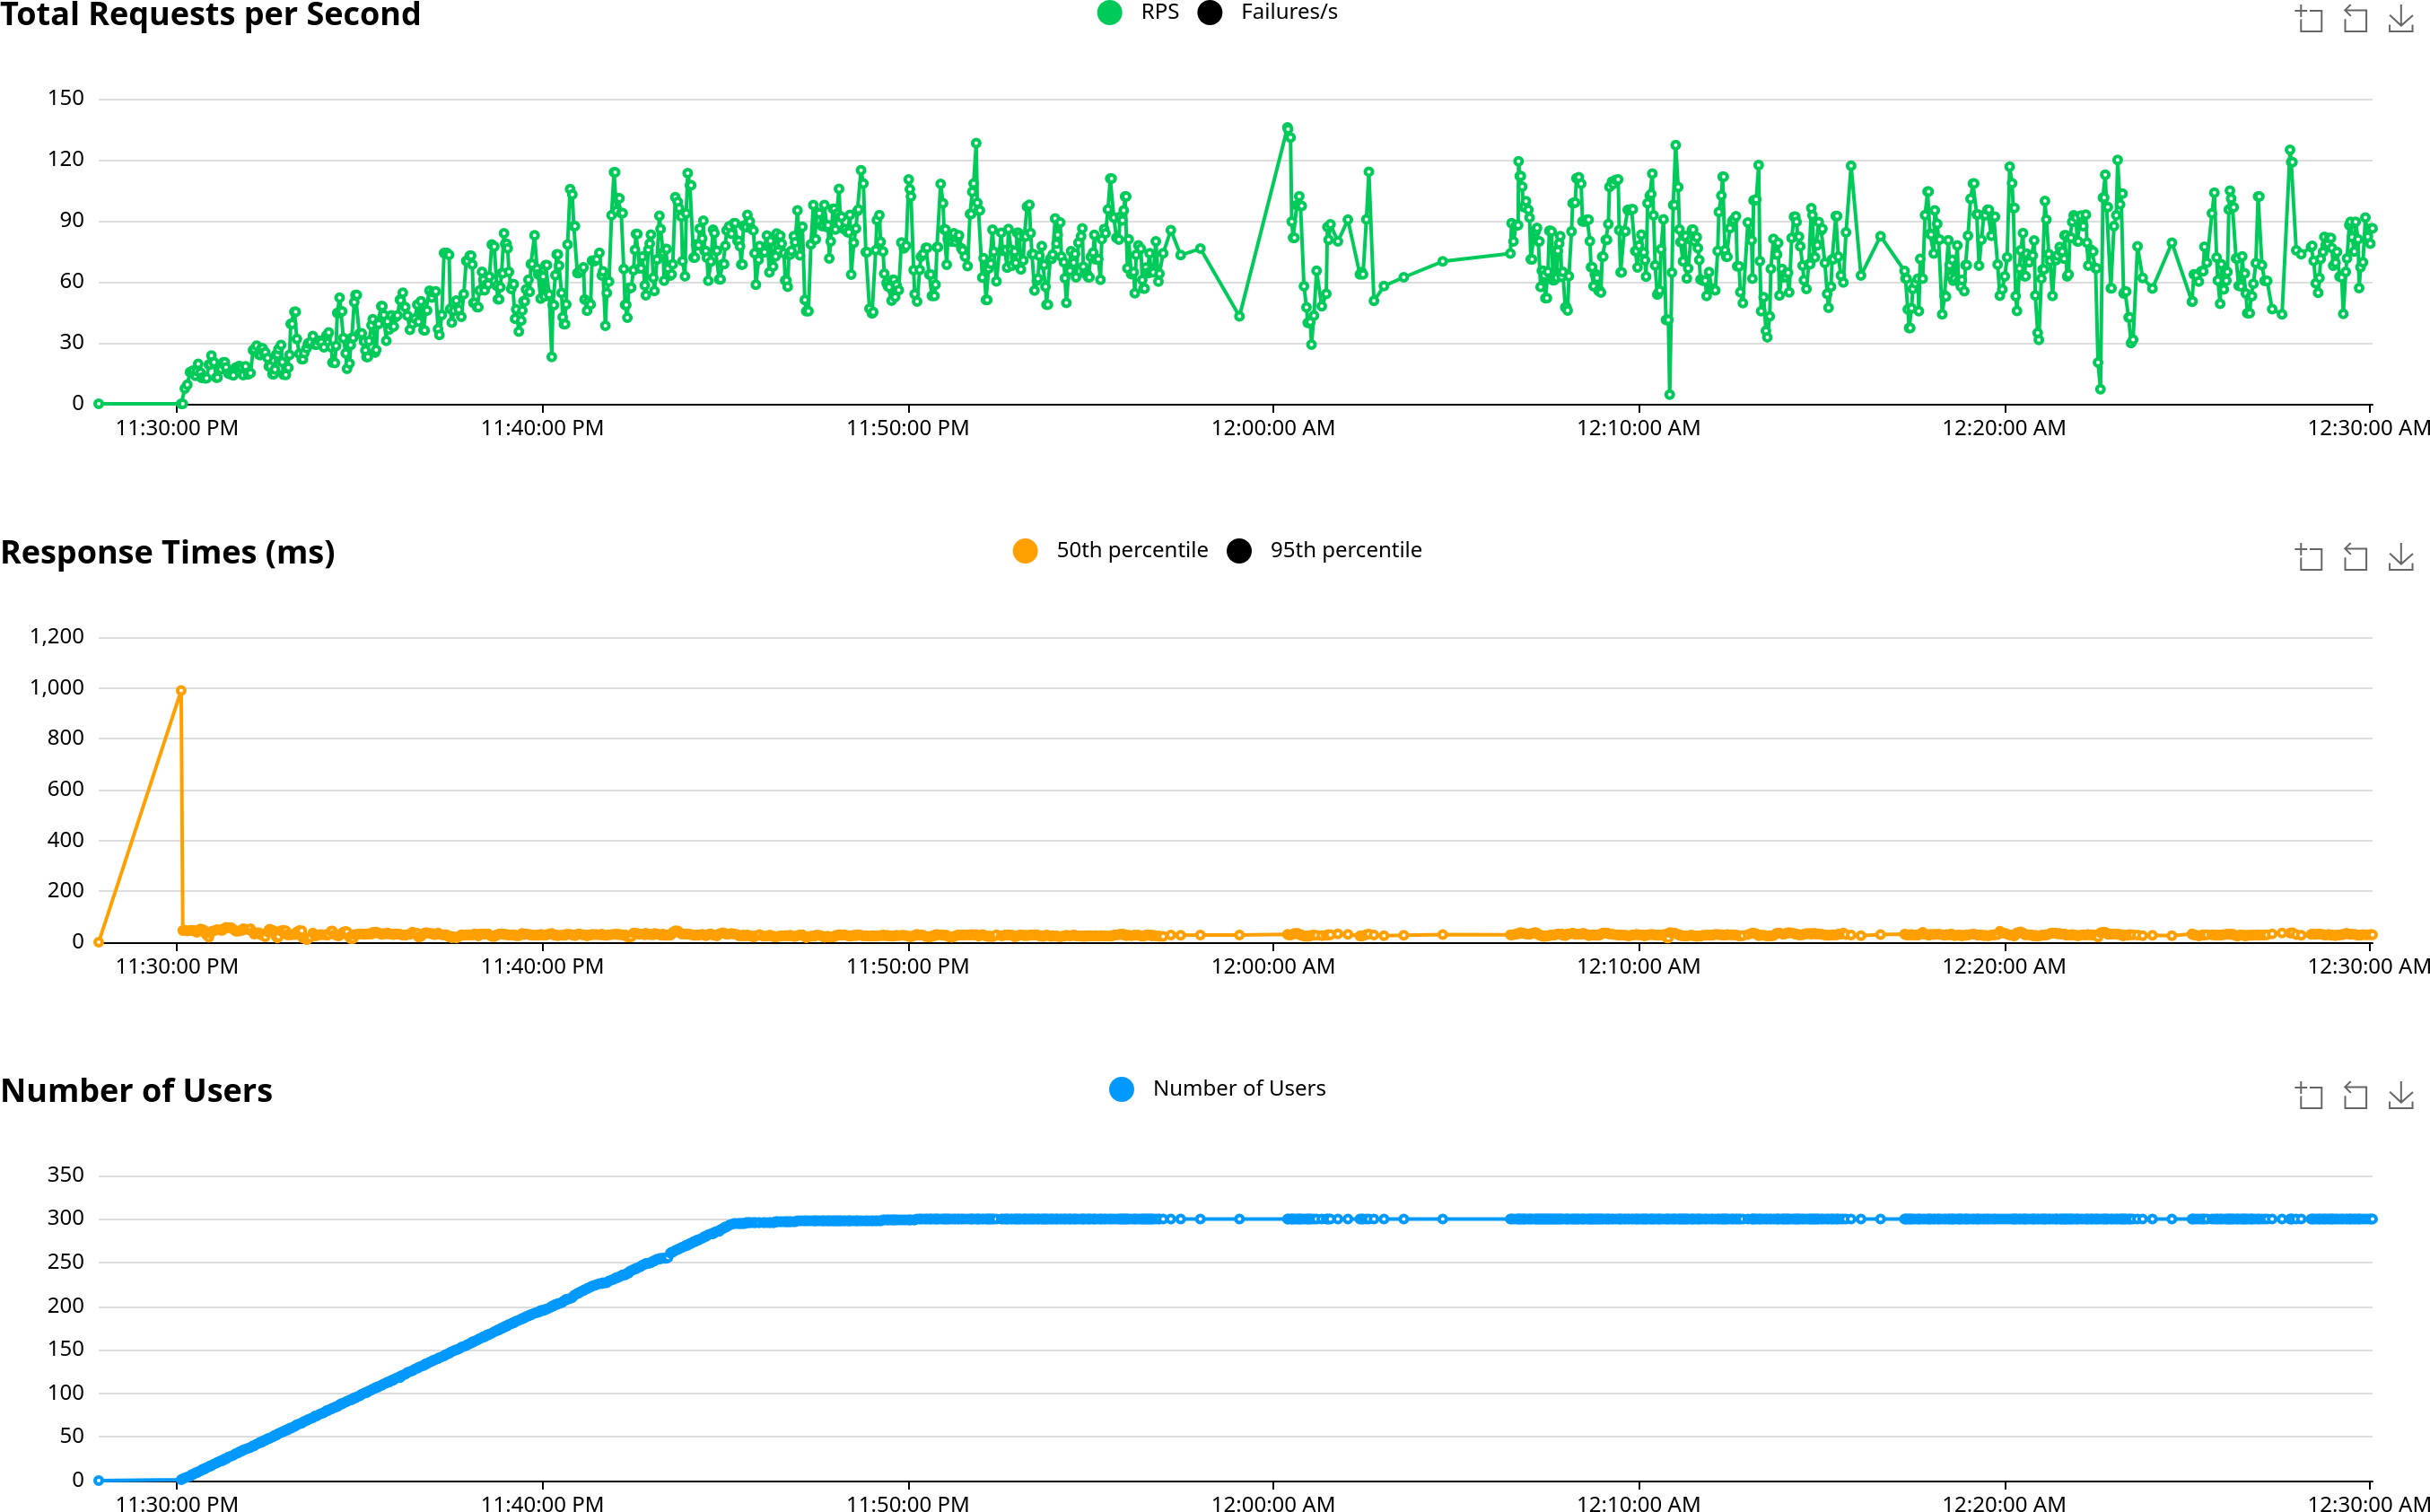
The results we’ve got are:
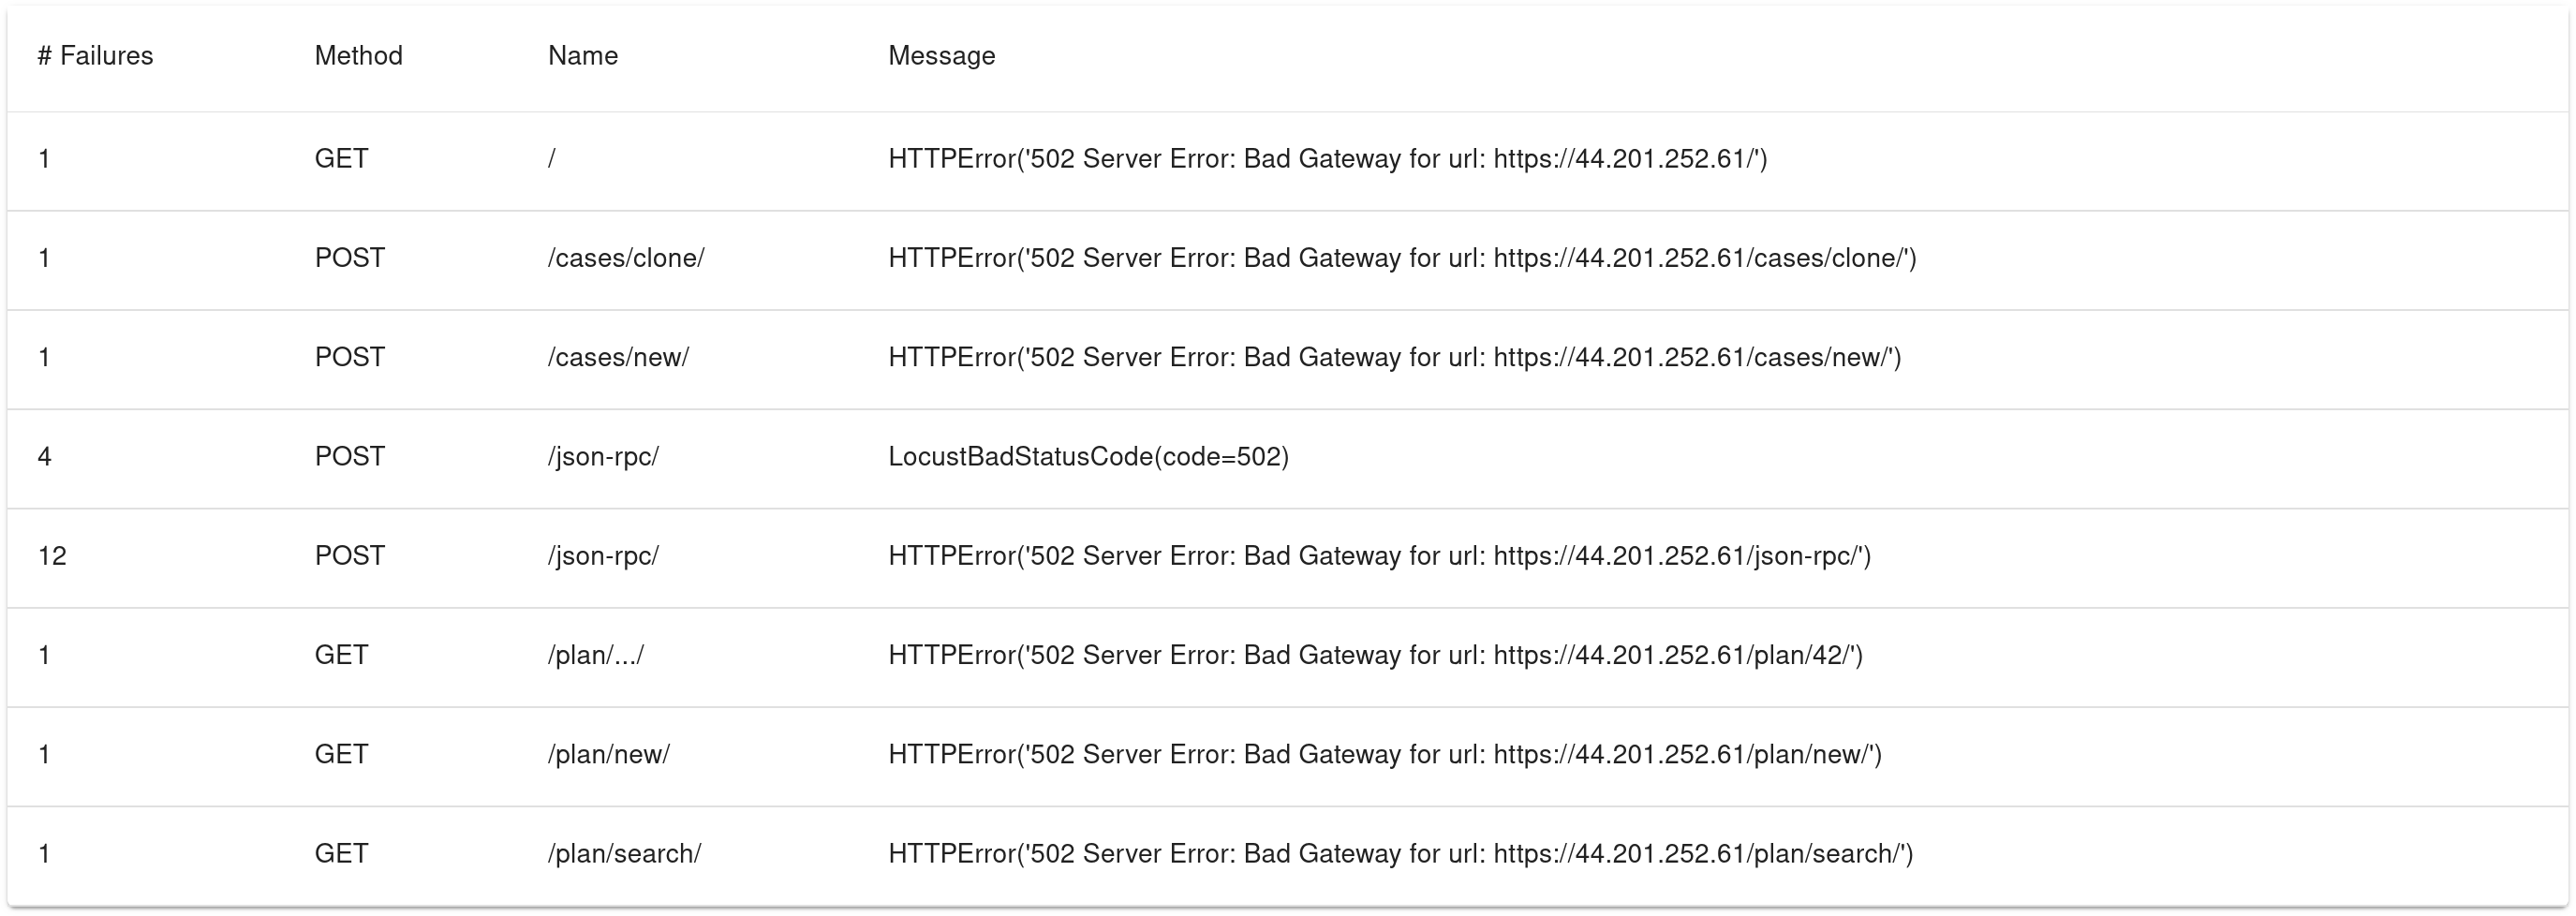
300 users were served with minimum errors; < 0.01% of all requests
Errors occured 2 mins before the end of the testing session; could also be related to other processes in the host OS eating up available CPU
Cloning (usually more than 1 TC) is the heaviest operation; followed by login and creating a new TR
Performance for individual pages must be analyzed separately
Median response time is relatively stable
95th percentile response time graph contains occasional spikes
We’ve seen more spikes when the ramp-up period is shorter
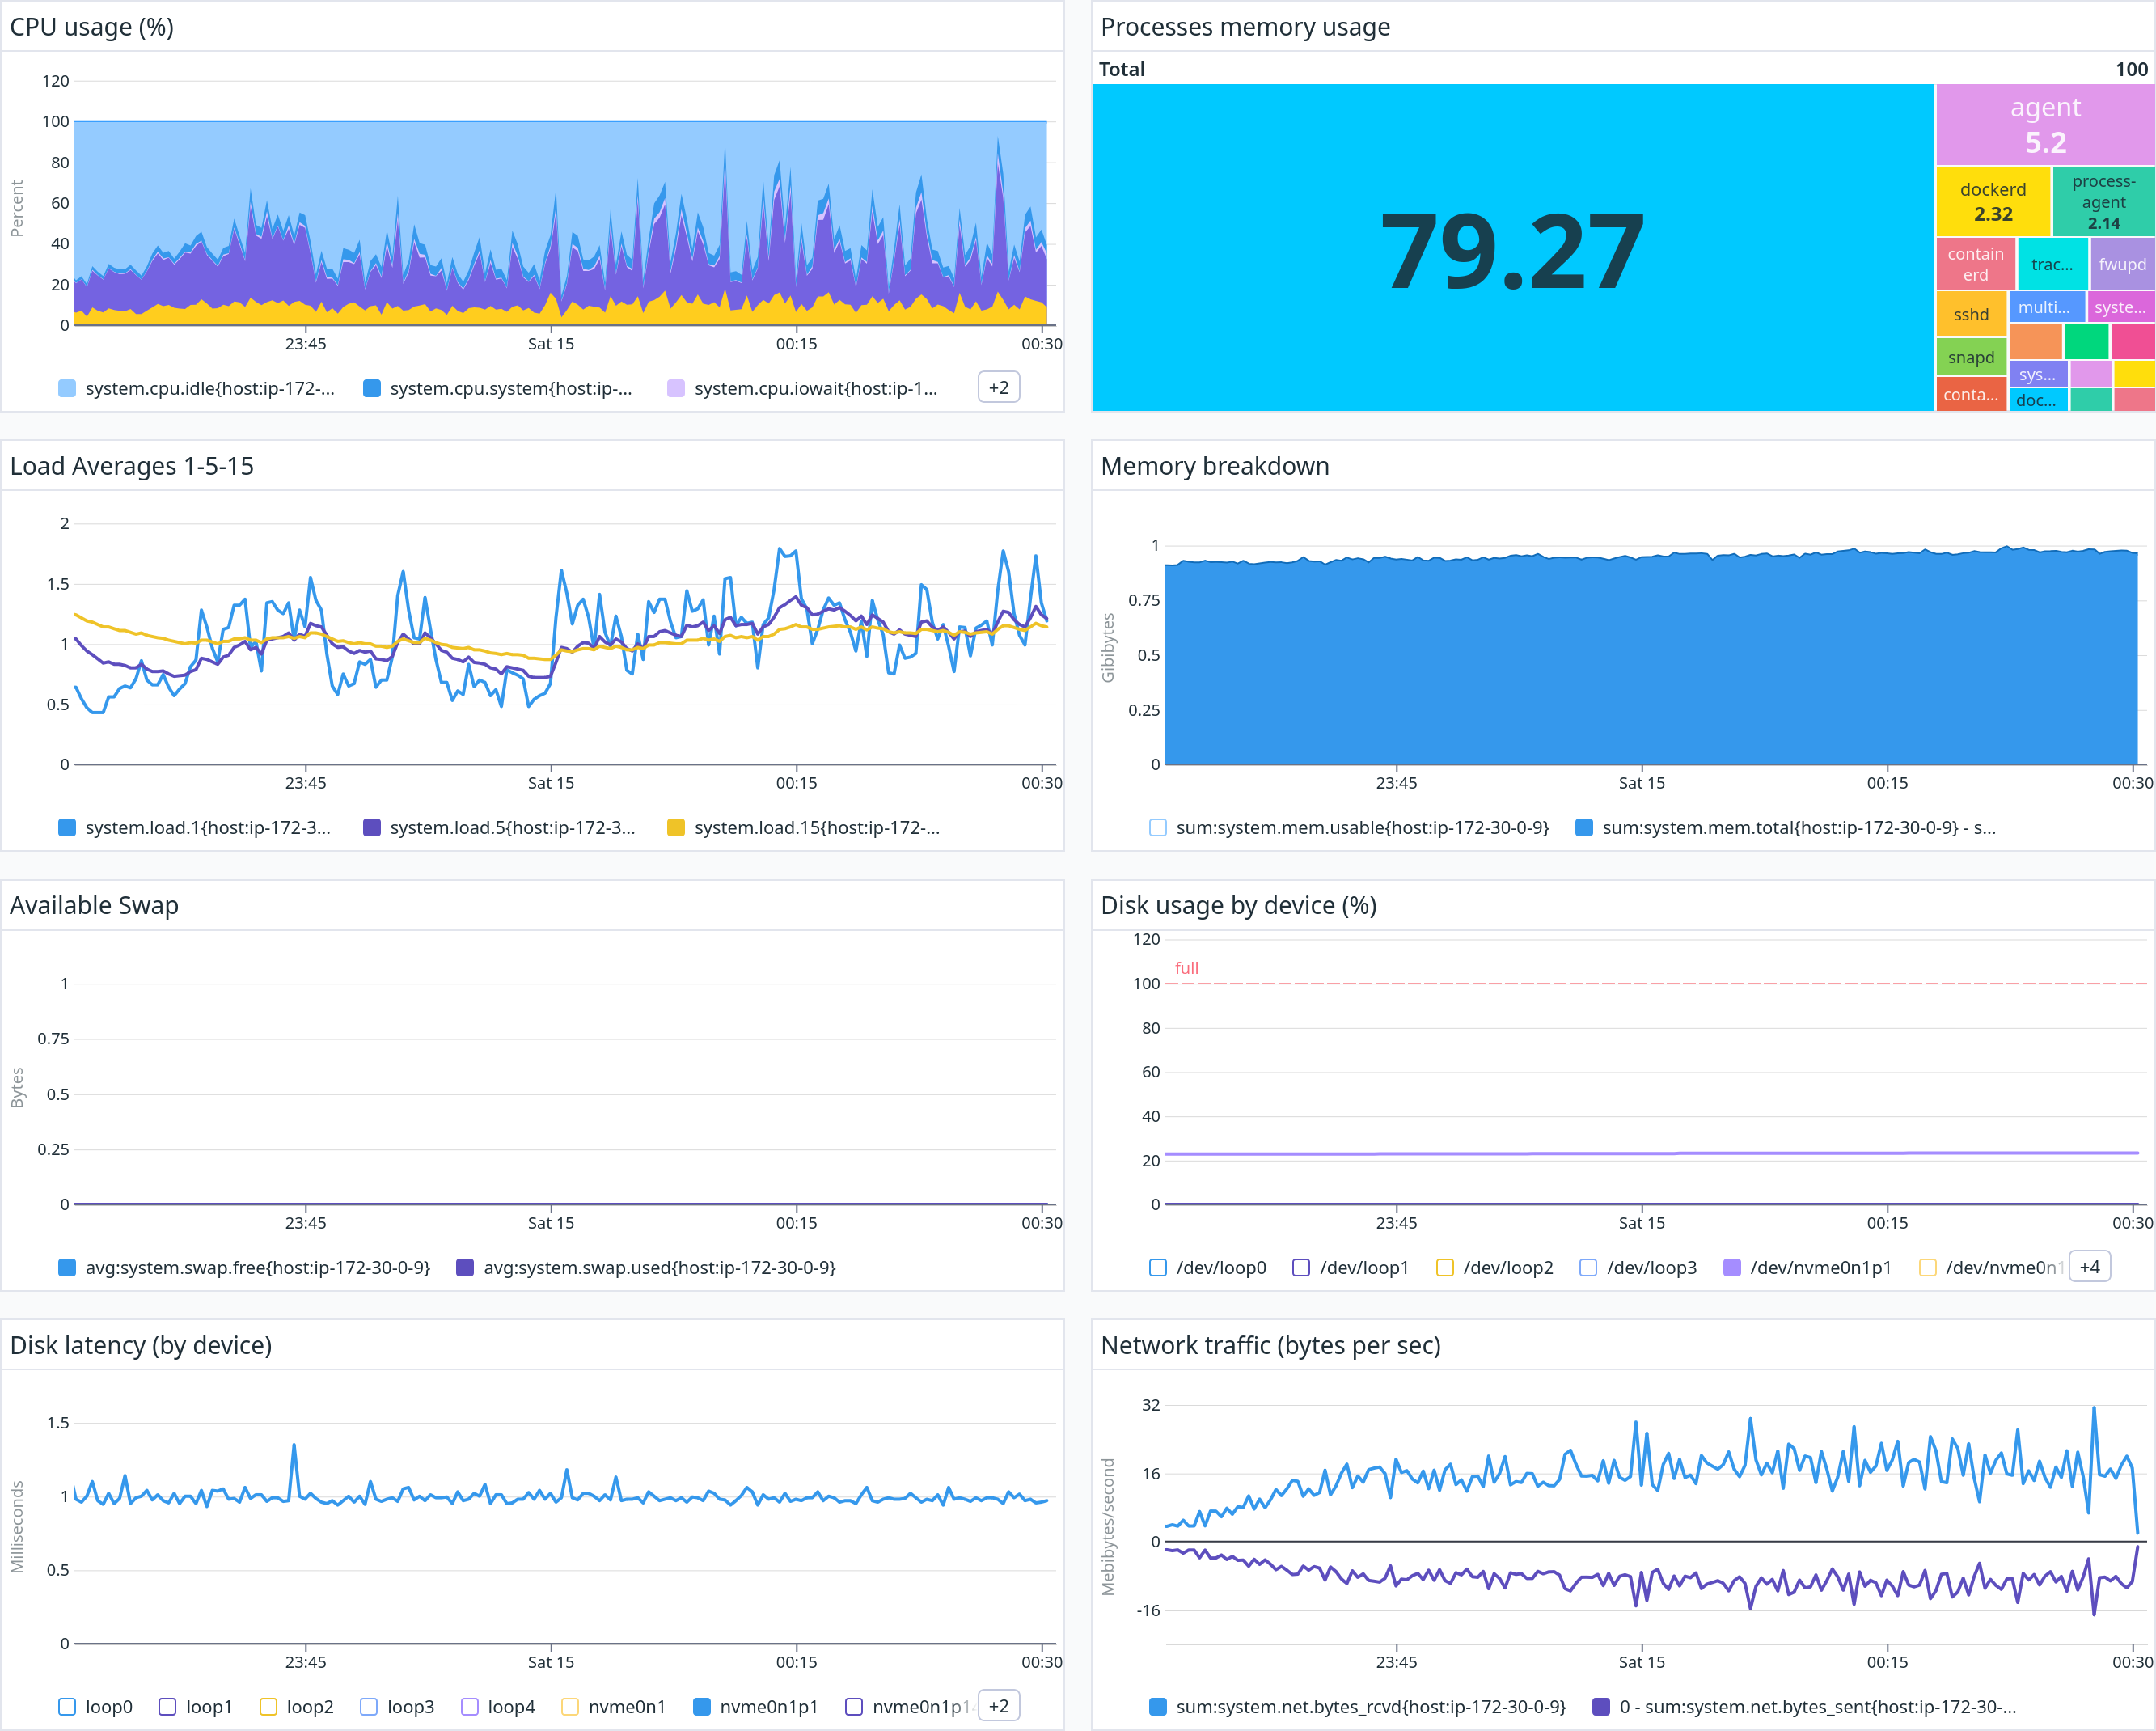
RAM usage is relatively constant; stayed < 1 GiB
CPU load is between 20-60%
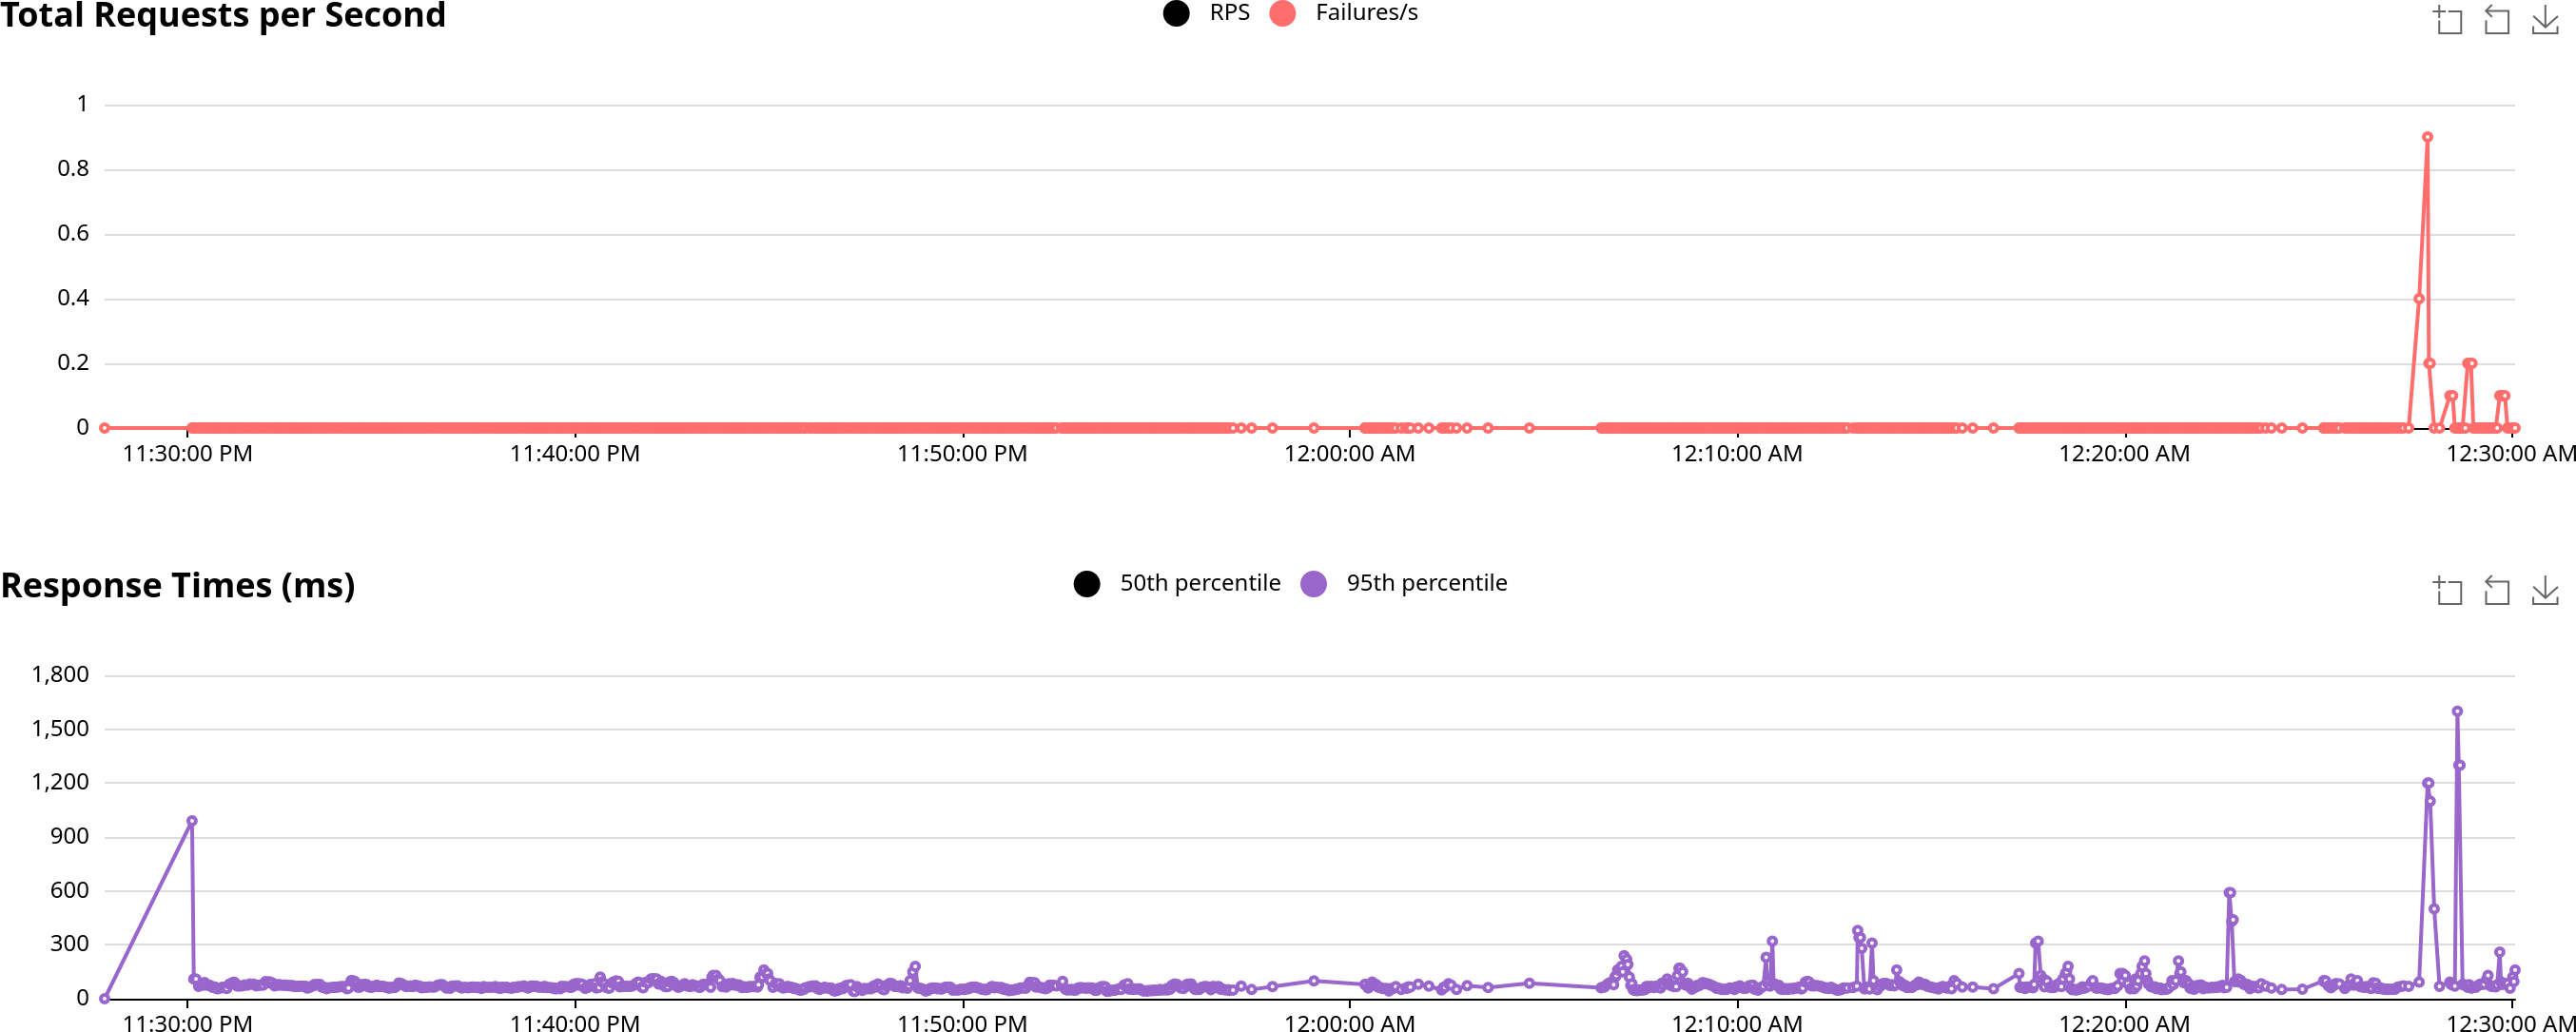
Important
Using a vanilla postgres:17.2 as the database container resulted in similar
outcome with very small differences (also remember the simulation itself contains
an element of randomness):
0 requests failed
Slightly higher requests/second served on average
Median response time for every individual request is slightly longer as pointed out above
Slightly more frequent spikes on the 95th percentile response time graph
CPU load is between 40-80%